| Temperature at Paradise |
MAXIMUM TEMPERATURE (Tmax): -999.99°F
MINIMUM TEMPERATURE (Tmin): -999.99°F
AVERAGE TEMPERATURE (Tavg): -999.99°F
MAXIMUM TEMPERATURE PERCENTILE (Tmax percentile): -9.999
Maximum Percentile on this day is based on 0 years of historic (1917-2017) records:
|
DEBRIS FLOW HAZARD MODEL:
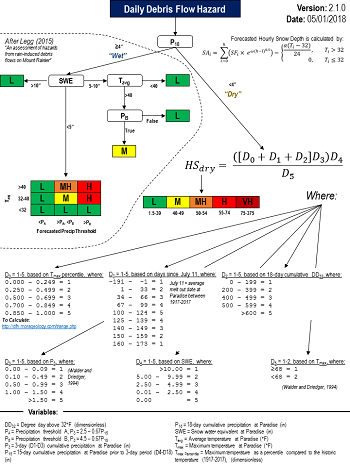
Click to zoom in
|
Degree Days above 32°F
(DD32) |
TODAY'S DD32: 0
18-DAY CUMULATIVE DD32: 0
DD32 is calculated as: DD32 = TMAX - 32
18-day Cumulative DD32 is the sum of DD32 for the last 18 days.
|
| Precipitation at Paradise |
DAY 1: -99.99 in
DAY 1-3 (P3): -99.99 in
DAY 4-15 (P15): -99.99 in
18-DAY TOTAL (P18): -99.99 in
PRECIP THRESHOLD A (PA) EXCEEDED: UND
P3 > (-0.67 * P15 + 2.5)
PRECIP THRESHOLD B (PB) EXCEEDED: UND
P3 > (-0.67 * P15 + 4.5)
|
| Snow at Paradise |
DEPTH: -999 in
SWE DAY: 238
CALCULATED SNOW DENSITY: 0.00 kg/m3
CALCULATED SWE: -9999.99 in
SWE Day, Calculated Snow Density, and Calculated SWE based on work by Sturm and others (2010)
If Tavg > 32°F, snow melt is factored in at: M (in) = a(Tavg - T32), where a is between 0.0766 - 0.1312 in * °F-1 * day-1 (Currently 0.1039) and T32 = 32°F. This method is from Westerstrom (1982) in Kustas and others (1994) and converted to US customary units.
|
| Seasonal Variables |
DAYS SINCE JULY 11: 0
July 11 is the average snow melt-out day (where snow depth goes down to 0 in) at Paradise
|
| Calculated Variables |
D0: 0
D1: 0
D2: 0
D3: 0
D4: 0
D5: 0
HSdry: 0.0
These are primarly for the Dry-weather debris flow hazard model, but calculated every day.
HSdry = (([D0 + D1 + D2] * D3) * D4) / D5
See model (right) to figure out how D0 - D5 are calculated.
|
| Notes |
|